150+ Customers | 12+ Years in Service | MSC Status

bi-desktop.jpg

Report authoring made easy

connect_630_472.gif
Connect to your data, any data

Explore your data wherever it is—in the cloud or on-premises—including big data sources such as Hadoop and Spark. With connections to hundreds of sources and constantly growing, Power BI Desktop lets you draw deep insights for a broad range of scenarios.

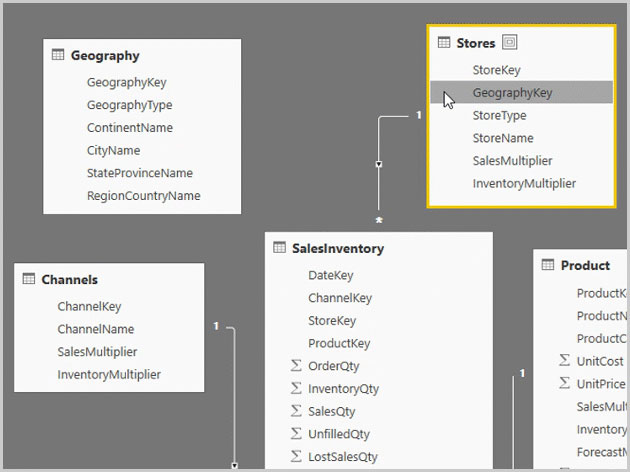
Prep and model your data with ease

Data prep can take most of your time. But it doesn’t have to, with Power BI Desktop data modeling. Clean, transform, and mash up data from multiple sources—in a few clicks. Reclaim hours in your day.

dataprep_630_472.jpg
provide_630_472.gif
Provide advanced analytics with the familiarity of Excel

Enable business users to dig deeper into data and find patterns they may have otherwise missed, with Power BI features like quick measures, grouping, forecasting, and clustering. Advanced users have full control over their model using powerful DAX formula language. If you’re familiar with Excel, you’ll feel at home in Power BI.

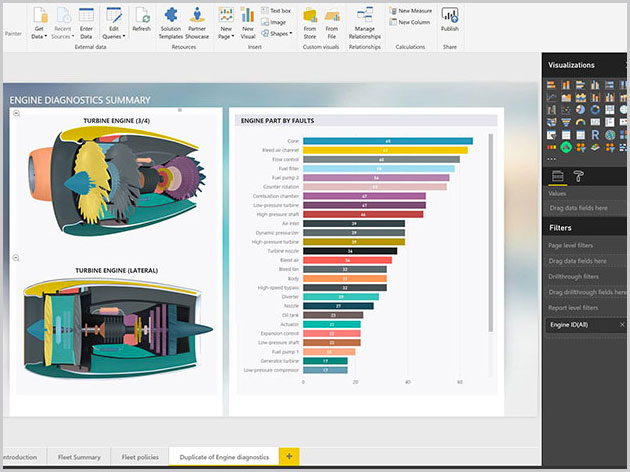
Create interactive reports customized for your business

Create stunning reports with interactive data visualizations. Tell your data story using a drag-and-drop canvas and more than 85 modern data visuals from Microsoft and partners—or create your own using the Power BI open source custom visuals framework. Design your report using theming, formatting, and layout tools.cks. Reclaim hours in your day.

visuals_630_472.jpg
author_630_472.gif
Author for everyone, anywhere

Get visual analytics to the people who need it. Create mobile-optimized reports for viewers to consume on the go. Publish from Power BI Desktop to the cloud or on-premises. Embed reports created in Power BI Desktop into existing apps or websites.

Power BI is a suite of business analytics tools to analyze data and share insights. Power BI dashboards provide a 360-degree view for business users with their most important metrics in one place, updated in real time, and available on all of their devices. With one click, users can explore the data behind their dashboard using intuitive tools that make finding answers easy. Creating a dashboard is simple thanks to over 50 connections to popular business applications, complete with pre-built dashboards crafted by experts that help you get up and running quickly. And you can access your data and reports from anywhere with the Power BI Mobile apps, which update automatically with any changes to your data.

If you are a data analyst delivering reporting and analytics to your organization, Power BI lets you be productive and creative with what you build. Power BI Desktop is a feature-rich data mashup and report authoring tool. Combine data from disparate databases, files, and web services with visual tools that help you understand and fix data quality and formatting issues automatically. With over 20 built-in visuals and a vibrant community of custom visualizations, create stunning reports that communicate your message effectively. With the Power BI service, publish reports securely to your organization and setup automatic data refresh so everyone has the latest information.

Power BI can unify all of your organization’s data, whether in the cloud or on-premises. Using the Power BI gateways, you can connect SQL Server databases, Analysis Services models, and many other data sources to your same dashboards in Power BI. If you already have reporting portals or applications, embed Power BI reports and dashboards for a unified experience.

Crest Business Solutions

We are information technology, consulting, and services company that specializes in developing software products and providing services to cater to the automation and process improvement needs

CONTACT US

CREST BUSINESS SOLUTIONS SDN BHD
6, Danau Desa Business Center,
Jalan 4/109f, Taman Danau Desa, 58100 Kuala Lumpur,
Malaysia

H/P (Whatsapp) - 0126721050

Phone: +603 7972 5186, Email: info@crestsolution.com.my